Workshop 1 Worksheet
Introduction
The lecture has introduced the complexities of measuring sociological concepts. Throughout this short course, we will be using the measurement and estimation of social trust as a guiding example. However, the aim is to help you build up your skills and confidence in asking and addressing research questions of your own, and the assessment questions will ask you to analyse some other chosen research topic.
In this first workshop, you will begin your data analysis journey by exploring some online sources of cross-national sociological data available for secondary analysis, and you will practice performing basic descriptive analyses of selected variables.
Learning outcomes
By the end of the session you will have gained familiarity with:
- some important UK-focused and international survey programmes and freely available data sources
- the challenges of measuring sociological concepts using surveys
- the basics of using a statistical data analysis software package: JASP
Exercise 0: Setup
Create a folder to store your data for this module on your institutional OneDrive platform (e.g. C:\OneDrive - Newcastle University\SOC2069). Within that folder, create a sub-folder called “Data”. You will then be able to save data files and documentation as you progress.
Exercise 1: Univariate descriptive statistics using JASP
About 30 minutes
The lecture has introduced some elementary concepts of descriptive statistics. In this first exercise we will practice performing univariate descriptive statistics using a statistical software package called JASP.
Task 1. Getting the data
As a first step, we need to find some data to explore. We will be using a number of small datasets that can be downloaded from here: https://cgmoreh.github.io/SOC2069-QUANT-25/Data/. On that page, you can roll down the first section called Questions of Trust and find the download button.
Under the Questions of Trust section you will find a collection of six small datasets compiled from original sources to exemplify several different ways in which the “social trust” / “generalised trust” question has been asked in social surveys. The datasets are helpful for thinking through questions about concept measurement similar to those asked by Bekkers and Sandberg (2019).
The focus of the datasets is on a single country: Great Britain / United Kingdom. The original datasets have been reduced to a small number of variables: (1) respondent ID number; (2) questionnaire subsample (if relevant and available); (3) age (both numeric and categorical (7 categories) where available); (4) sex; (5) and social trust. The order of the variables in the dataset, variable names and labels, and value/category codes and labels - including missing values - were left as in the original surveys (the only exception is the gb-cls23-trust_nm dataset, where the missing values have been excluded due to the large size of the original file - over 100,000 rows - which cannot be opened by JASP). The datasets can be downloaded in .sav (SPSS) format and loaded directly in JASP or R.
The available datasets and their original sources are:
- British Social Attitudes Survey 2024 (
gb-bsa24-trust.sav) - British Social Attitudes Survey 2023 (
gb-bsa23-trust.sav) - British Social Attitudes Survey 2010 (
gb-bsa10-trust.sav) - Community Life Survey 2023-24 (
gb-cls23-trust_nm.sav) - Citizenship Survey 2010-11 (
gb-cs10-trust.sav) - European Social Survey, Round 11, 2023-24 (UK sample) (
gb-ess11-trust.sav)
Download each dataset to the “Data” folder you created in Exercise 0 earlier. As we will only be using these datasets in this workshop, it may be a clean approach to create another sub-folder for this week (e.g. “w1) and store the datasets there.
Task 2. Opening the data in JASP
Open the JASP software from the Start menu. If you are using your own laptop, you can install the latest version of JASP from https://jasp-stats.org/.
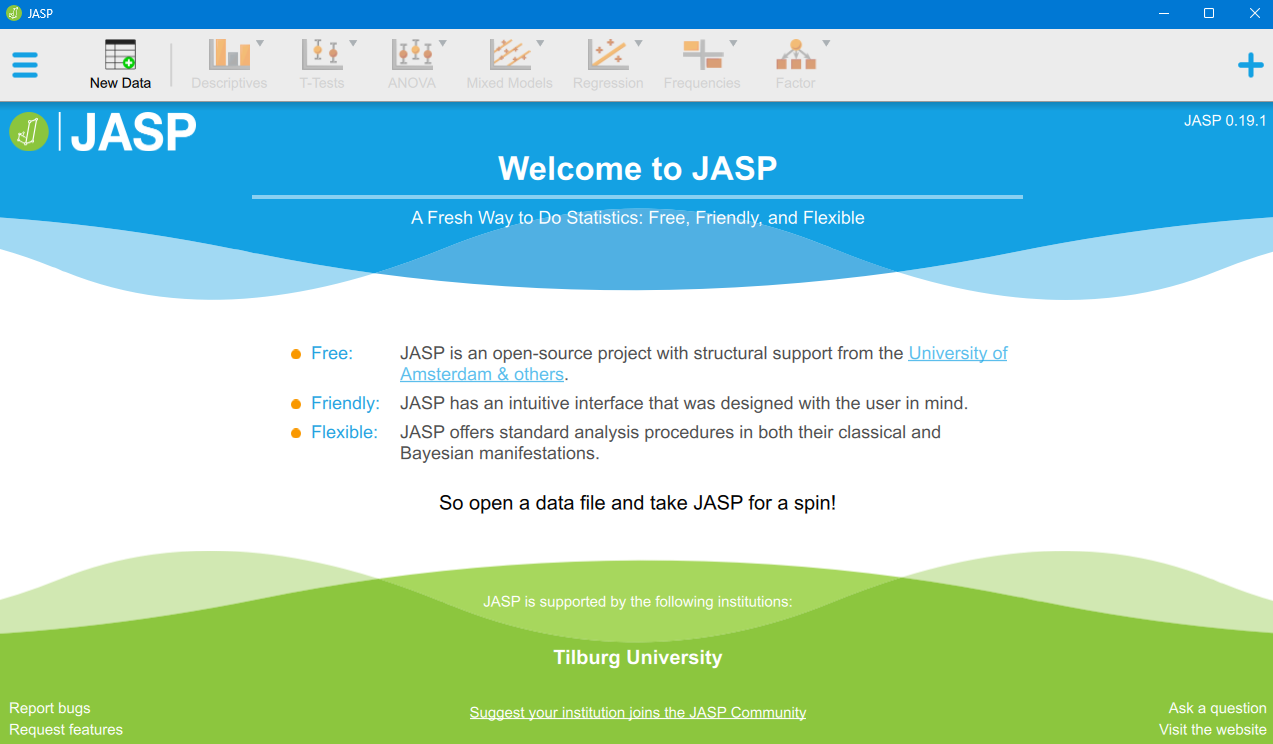
The opening page should look something like this:
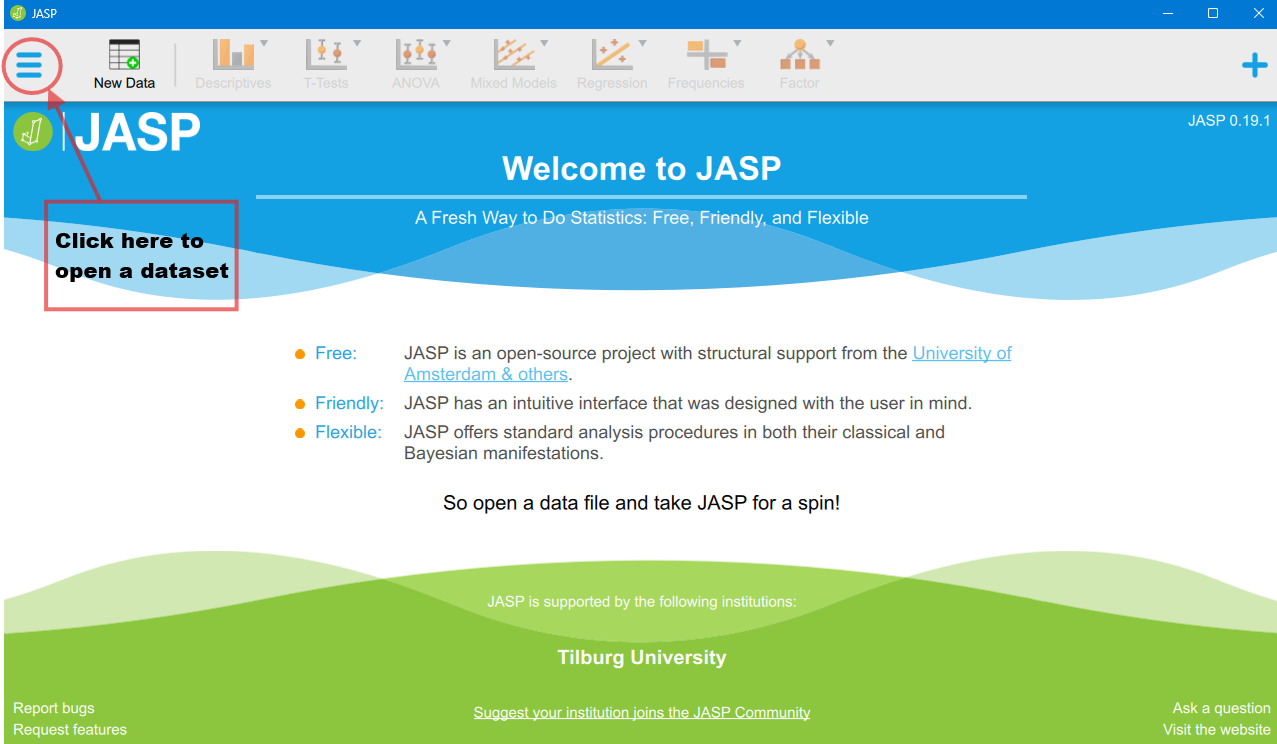
To open a dataset stored on your computer, you can navigate to the three horizontal bars (“hamburger”) menu icon > Open > Computer > Browse.
In JASP you can work on one dataset at a time (or in one window), but you can open several datasets in separate JASP instances/windows. For now, work with one dataset. When you finish your analysis, you can save both the dataset and the outputs you generated as one .jasp file, which you can then open later and continue or alter your analyses.
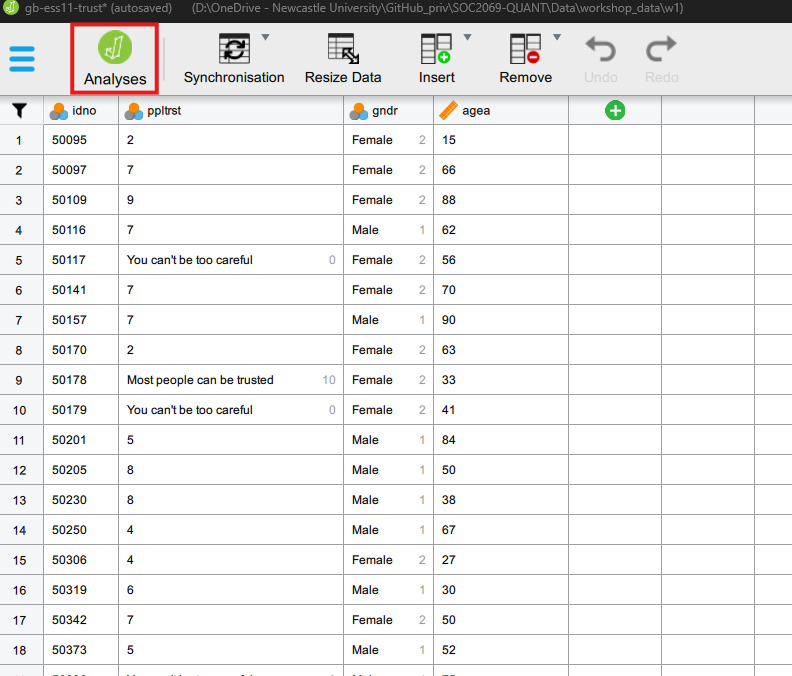
Open the gb-ess11-trust.sav dataset. You should now see something like this:
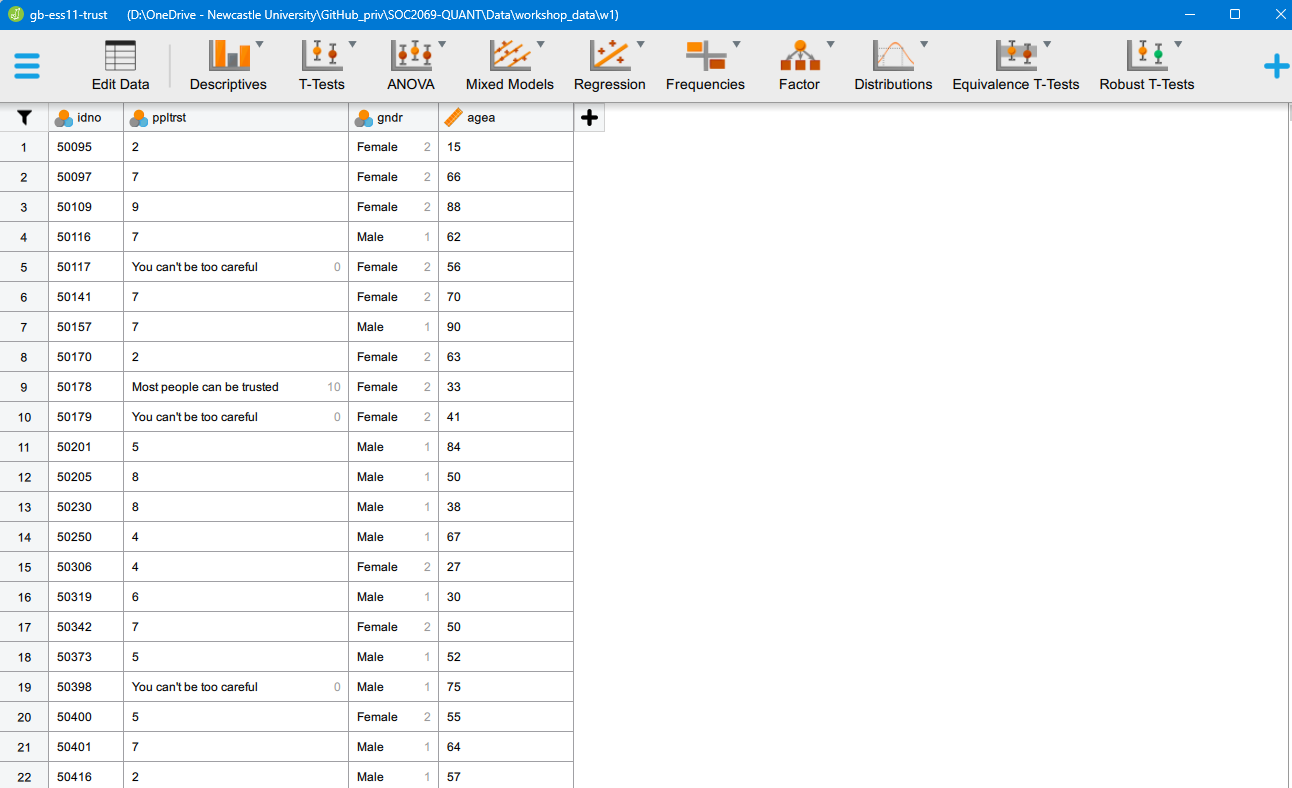
You can scroll up-down and left-right in the dataset to have a look at the spreadsheet and its contents. In this case, the dataset is very small, only contains four variables, so there is no need to scroll horizontally to inspect variables as it all fits on the screen.
Task 3. Switch between the Analyses view and the Data Editor view
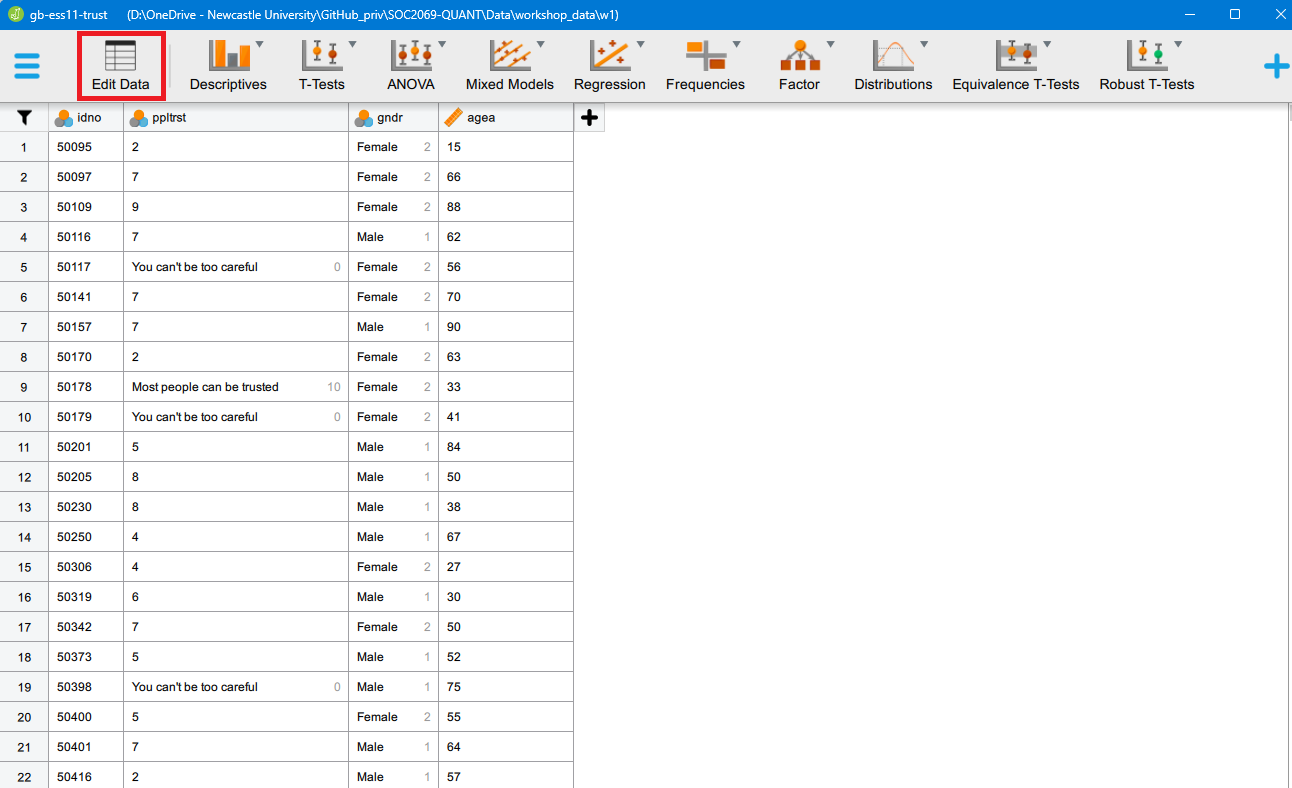
What we see is the “analysis view”, the main window that we will be using to perform analyses. We can also manually edit our data if we ever need to by clicking on the “Edit Data” tab:
That will take us to the “data view”, which is a dangerous place to be because we can manually alter our data, maybe even involuntarily. We will often need to perform changes to our data, but for now we can return to the analysis view window by clicking on the “Analyses” tab:
Task 4. Univariate descriptive statistics
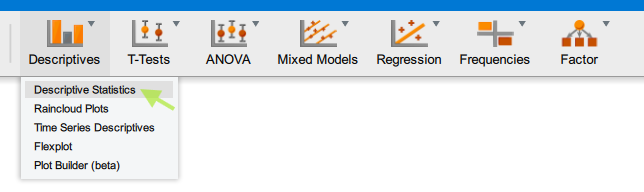
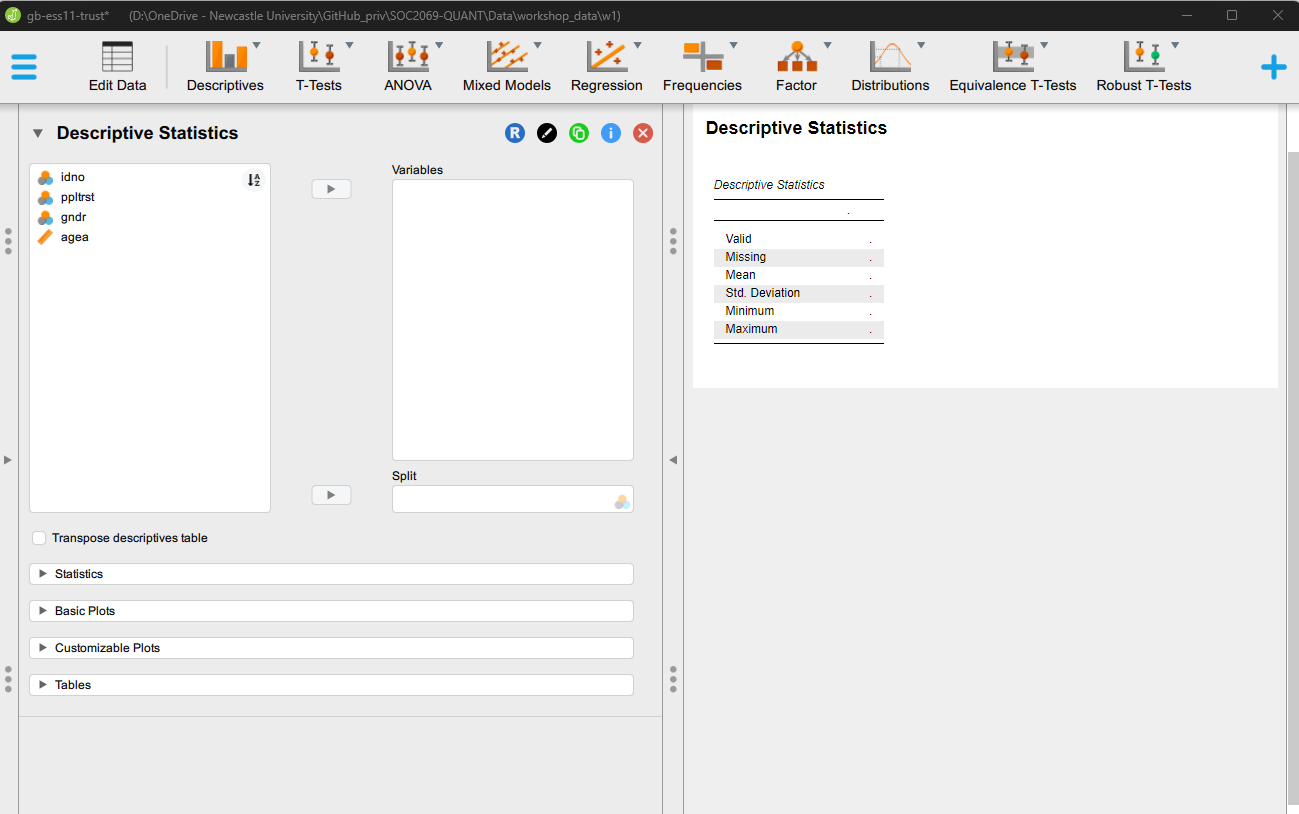
We will explore some descriptive statistics using the Descriptives > Descriptive Statistics menu option. If you click through, you should see something like this:
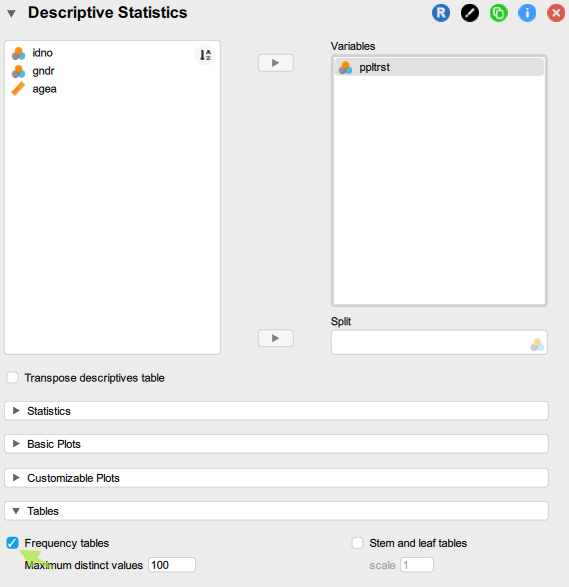
Step 1: Identify the variable referring to “social/generalised trust” and move that variable to the Variables field
Step 2: Under Tables, select Frequency tables and set the Maximum distinct values to a much higher number (e.g. 100 - this latter step is only needed because the ppltrst variable has 11 valid categories and the default maximum number of distinct values for Frequency tables to be produced is 10. This default setting is reasonable, given that it is difficult to read off too much useful information from a long frequency table, as we will see in the output):
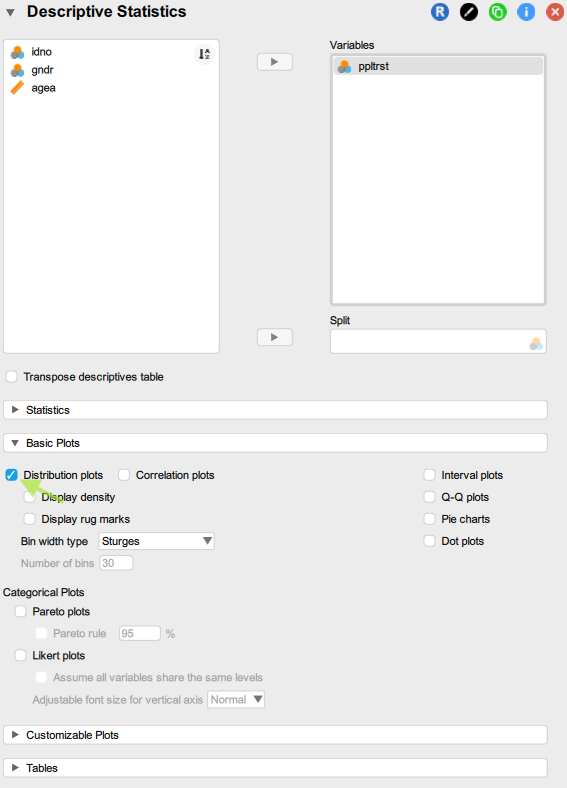
Step 3: Under Basic plots select Distribution plots as well
Now check the output that was automatically generated in the panel on the right and interpret the results; use the guiding questions below
Questions
- How many levels (categories) does the variable have in your dataset? Is it what you had expected based on the questionnaire information from the lecture slides?
- Does the variables have any missing values in your dataset?
- What is the “Mode” of the variable, and what does that mean?
- What percentage of the respondents in your dataset had answered that “Most people can be trusted”?
- What is the most common answer category, and what do these descriptive statistics tell you about social trust in this sample?
- Is this “social trust” variable a categorical variable, or should we treat it as a scale variable instead?
Task 5. Change the type of a variable for a single analysis
You may have answered to the last question point that our “social trust” variable (ppltrst) should instead be treated as a “Scale” variable, because it measures its concept on a relatively “long” discrete ordinal scale running from 0 to 10. If so, then can can change the type of the variable to “Scale” so that JASP recognises it as such in statistical analyses.
Step 1: Begin a new analysis in the same JASP workbook and it will be added to our current work; let’s click again on the Descriptives > Descriptive Statistics menu option and start a new descriptive analysis;
Step 2: Let’s move the “social trust” variable again into the Variables field;
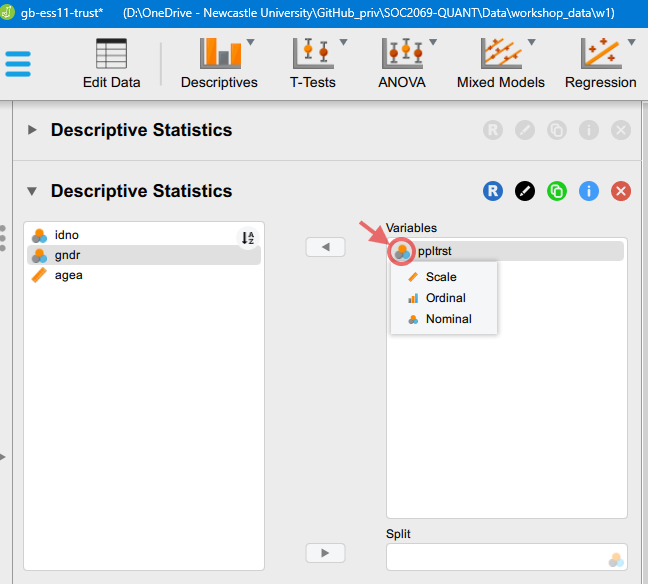
Step 3: But now let’s click on the measurement type icon, which will bring up the options we see in the image below:
Change the measurement type to “Scale” and check how the Descriptive Statistics output table on the right hand side has changed. Now that the variable is recognised as a numeric scale measure, we are shown the full set of relevant statistics: Minimum and Maximum values, the Mean, and the Standard Deviation.
Task 6. Select additional summary statistics
We can select many additional descriptive statistic if we want to by clicking on the Statistics option:
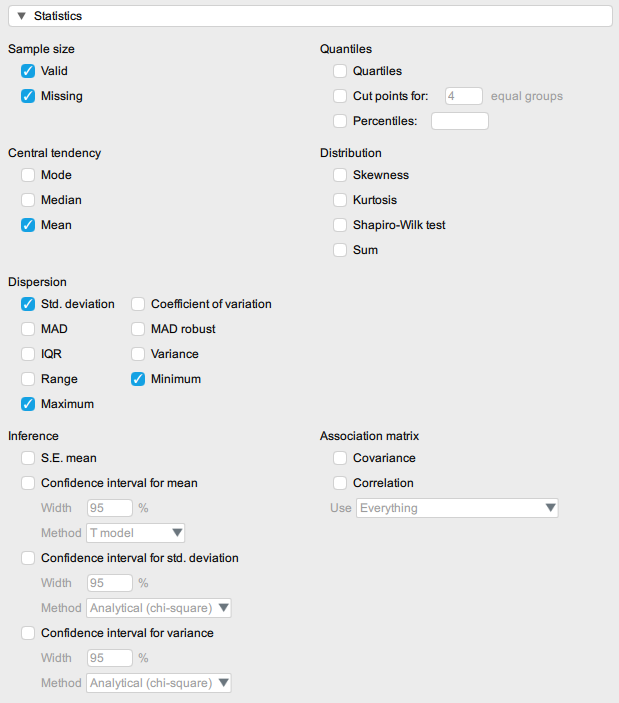
Check the Mode and the Median boxes too and look at how the output table has changed. Think about the questions below.
Questions
- What is the average level of social trust in this sample?
- What is median level of trust in this sample? Comapring the median to the mean, what can we say about the distribution of our social trust variable?
- What is the most common answer category?
- Is this “social trust” variable a categorical variable, or should we treat it as a scale variable instead?
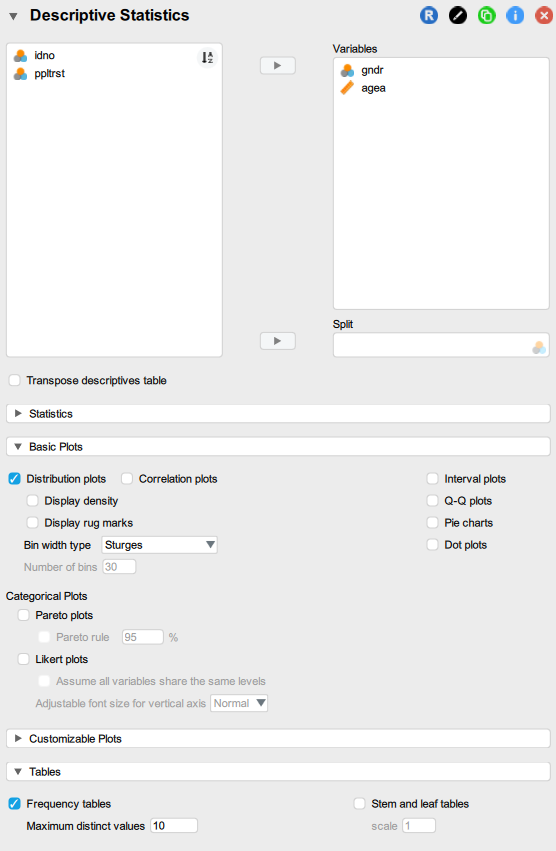
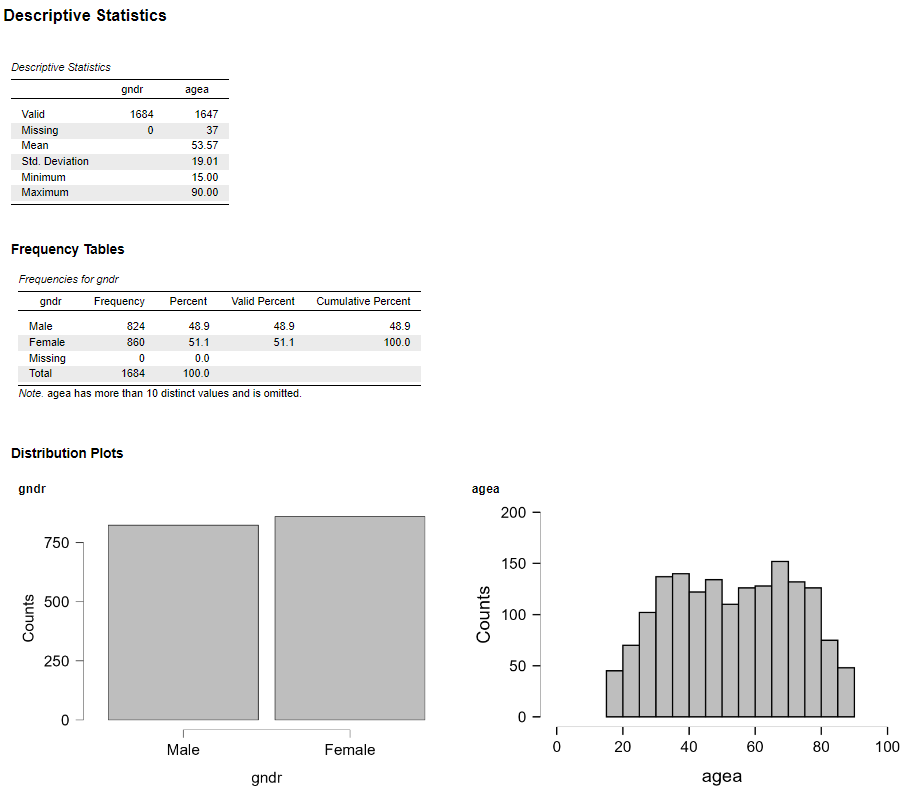
Task 7. On your own: describe other variables in the dataset
Start a new descriptive analysis in this same JASP file and describe the age and the sex variable, just like we have done with “social trust”.
Task 8. Save your analysis
To save your analysis, click through Hamburger menu tab > Save as > Computer > Browse and save the analysis in your data folder with the name “ess11-example.jasp” (or anything else that you find useful). Once it’s saved, you can close the analysis. You can now open the .jasp file you saved and continue or modify the analysis you have started.
Once your analysis is saved, you can close this JASP session.
Exercise 2
Now open a new JASP session and import another of the downloaded datasets. Perform a univariate descriptive analysis of the variables related to social trust and other variables in the dataset similar to what you have done above. When complete, save that analysis to a .jasp file too.
To practice, explore a few of the downloaded datasets.
Exercise 3: Begin your analysis for Assignment 2
Below are some research questions that you can choose from to address in Assignment 2:
- Are religious people more satisfied with life?
- Are older people more likely to see the death penalty as justifiable?
- What factors are associated with opinions about future European Union enlargement among Europeans?
- Is higher internet use associated with stronger anti-immigrant sentiments?
- How does victimisation relate to trust in the police?
- What factors are associated with belief in life after death?
- Are government/public sector employees more inclined to perceive higher levels of corruption than those working in the private sector?
For now, choose one question that you find most sympathetic (you don’t need to stick with it for the assignment, but you could if you wanted to!). All of the questions can be answered with at least one of the survey datasets available on the https://cgmoreh.github.io/SOC2069-QUANT-25/Data/ page under the “Assessment Data” heading, and often more than one dataset contains potentially relevant variables.
Identify your “explanandum” - i.e. the core phenomenon/concept/behaviour/etc. that the research question aims to explain. The questions all postulate a relationship/association between two or more variables (the topic of the next workshop), but for now, think carefully about the question and how it is formulated, and identify which is the variable that will be the target of explanation, and which variable (if mentioned) will be used for explaining it. For example, in the research question “Does education increase social trust?”, the variable we are interested in explaining is “social trust”, while “education” is the variable that we will use to explain it. In later workshops we will develop better vocabulary to describe associations between variables.
Once the core phenomenon to be explained is identified, look through the two survey questionnaires to identify any variables that might exist in the dataset that captures it. This may require some trial-and-error with testing out search words.
Once you have found one (or several) candidate variable(s), navigate to the relevant survey website and select a single country for which to download data. You will be working with single-country datasets for your assignment. Download the dataset, import it into JASP, find the relevant variable and perform some descriptive analysis on the chosen variable as you have done in the previous exercise.
Make sure to add your noted and interpretations on the analysis results and save your analysis for later. You could create a new sub-folder for your “Assignment 2” work and save your analysis there for future use. If you end up liking your chosen question, you can continue this analysis in the next workshop.
Take-home exercises
Exercise H1: Explore the World Values Survey data documentation
- Navigate to the The World Values Survey (WVS) website and read about the World Values Survey.
Don’t spend too much time browsing the website, but make sure you can answer the following questions:
- When was the WVS started, and how many waves of data collection have there been so far?
- In which year(s) did the most recent wave of data collection take place?
- How many countries were covered by the most recent wave?
- Can you name some of the topics covered by the WVS?
- What population are the national samples representative of?
- What is the general minimum sample size per country?
- Is the WVS data freely available for academic research purposes?
- Do you need to cite/reference the WVS data if you use it in your research?
- Bonus: what is the difference between a time series dataset and a panel dataset, and which of the two can the WVS provide? (tip: look under Data and Documentation > Data Download > Timeseries (1981-2022) for a concise discussion)
- Navigate to Data and Documentation > Data Download > Wave 7 (2017-2022) page and explore the Questionnaire and Documentation. Download the Master Questionnaire and the Codebook documents and using the search function identify all the survey questions and variables that relate to “trust”.
Questions
- How many questions relating to trust have you identified in the questionnaires?
- What is the difference between the questionnaire and the codebook?
- In how many different ways is trust measured in the WVS?
- What are, in your opinion, the advantages and disadvantages of the different measurements of trust?
Within the “Data” sub-folder you created earlier, create another sub-folder called “WVS7”. You can now save the Master Questionnaire and the Codebook into that folder, and because it is stored on the institutional OneDrive, you will always have access to it on any computer, once you log in to your institutional Microsoft Windows account.
In the Select a country panel on the right side of the Wave 7 (2017-2022) page select one country at random and under Data files download the country-specific dataset (for consistency, download the first data type option,
CSV(i.e. comma separated values)) to the “WVS7” subfolder you created earlier.
JASP solutions
Below you can download JASP files with solutions to some of the exercises in this worksheet: